2026 Housing Market Outlook: A Dated Forecast Check
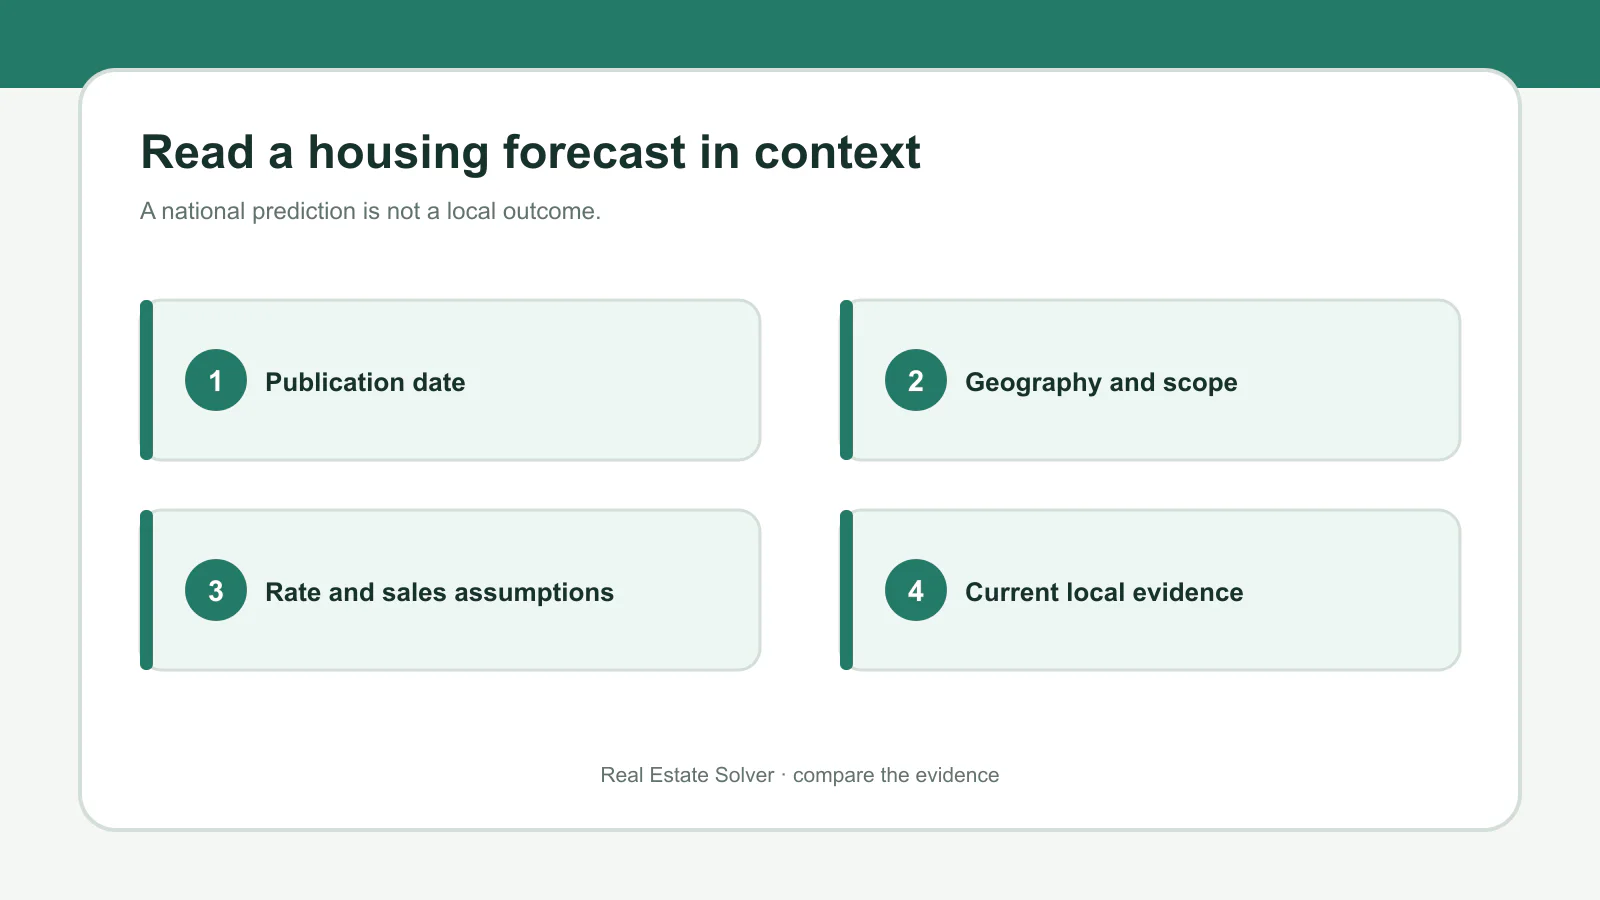
Image: Real Estate Solver
Data and source check: 27 July 2026. Forecasts are estimates, not outcomes, and can be revised.
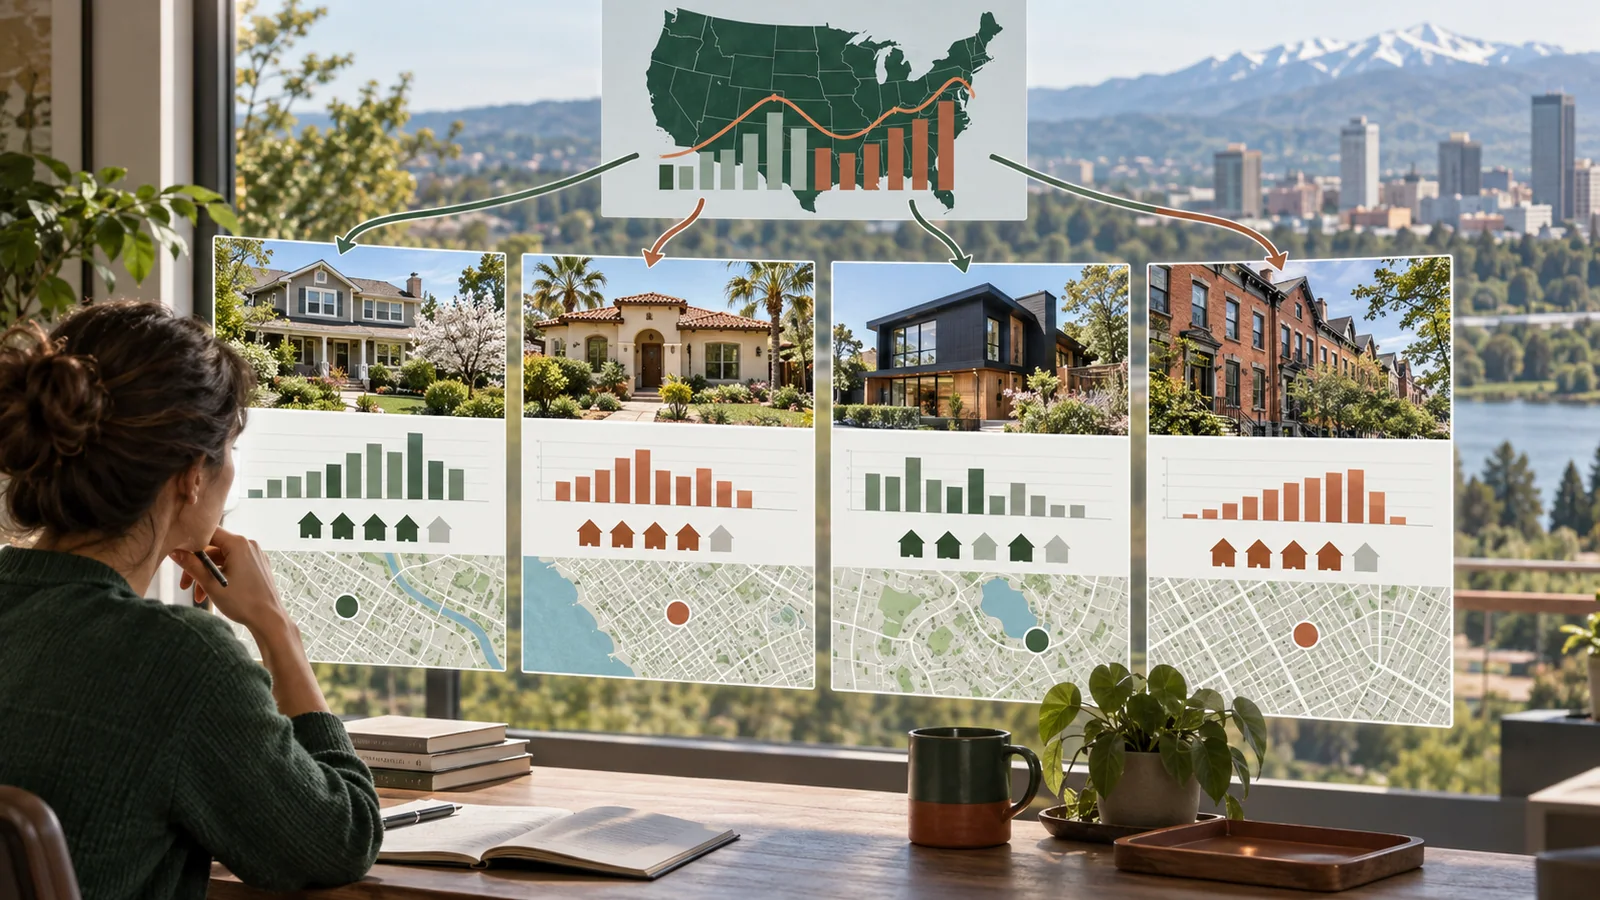
The 2026 housing outlook is not one agreed prediction. Major housing organizations publish different assumptions and revise them as rates, sales, inflation, and economic conditions change.
An earlier version of this article repeated the National Association of REALTORS’ late-2025 forecast that existing-home sales could rise 14% in 2026. NAR’s April 2026 outlook revised that forecast to 4% and projected an average 2026 mortgage rate of 6.5%. See NAR’s dated April 2026 economic outlook.
What current national sources say
As of the source-check date:
- NAR’s April forecast projected 4% growth in existing-home sales for 2026.
- Fannie Mae’s July 2026 housing forecast projected 0.2% growth in total home sales, 1.2% growth in existing-home sales, 2.3% home-price growth, and a 6.3% average 30-year mortgage rate for 2026.
- Freddie Mac’s weekly survey reported an average 6.58% 30-year fixed mortgage rate on 23 July 2026. Use Freddie Mac’s current mortgage-rate page for the newest release.
These figures are not directly interchangeable. They come from different models, measures, and release dates.
Forecasts versus observations
A forecast describes what an organization expects. An observed measure describes what its dataset recorded. Keep them separate.
For current national sales observations, use NAR’s existing-home-sales releases. For a local decision, national sales and rate headlines are only context.
Build a local market check
Collect dated, geographically relevant measures:
| Measure | Question to answer |
|---|---|
| Closed sales | How many comparable homes closed in the selected period? |
| Active inventory | How many relevant alternatives are available now? |
| New and pending listings | Is supply or contract activity changing? |
| Median price | Which property type and geography does it cover? |
| Days on market | How is the source defining the measure? |
| List-to-sale ratio | Are concessions included or excluded? |
| Financing mix | How many recent closings used cash or financing? |
Use the same property type, geography, and time window when comparing periods. A metro-wide statistic may not describe a ZIP code or neighborhood.
What buyers should verify
- the current interest rate and loan terms actually offered to them;
- taxes, insurance, association charges, and maintenance;
- comparable closed sales and competing listings;
- inspection, appraisal, financing, and title conditions;
- the effect of a different rate or price on the full payment.
What sellers should verify
- recent comparable sales, not only active asking prices;
- current competition and pending activity;
- likely preparation and concession scenarios;
- written estimates of proceeds under each offer;
- contract contingencies and evidence of the buyer’s ability to close.
No national forecast determines the correct local price or guarantees that waiting will improve an outcome.
Key takeaway
Use forecasts as dated scenarios. For an actual decision, pair them with current local data, written financing terms, comparable sales, and the specific contract.
General market education only, not financial, investment, mortgage, tax, or legal advice.
housing marketmarket outlookmortgage ratesbuyerssellers